Make Every Data Point Count
Learn how Carbonleap for Farms transforms disorganized inputs into powerful insights that fuel efficiency, growth, and sustainability.
No Data Team? No Problem
Design and gather structured data directly from workers, labs, sensors, or external systems.
Collect structured data from multiple sources
Simple integration of inputs from workers, consultants, labs, sensors and external systems
Easily submit photos and voice notes from a mobile phone in the field
Build a complete picture of your farm's health using a wide variety of data
Streamline Every Farm Task
Assign, track, and complete data-related tasks across teams, locations, and partner organizations.
Assign, track, and complete farm-related data tasks across teams and organizations
Easily see when tasks were completed and by which worker to ensure easy follow-up
Identify tasks which are overdue and if there are blockers
Remove uncertainty and ambiguity from task assignment
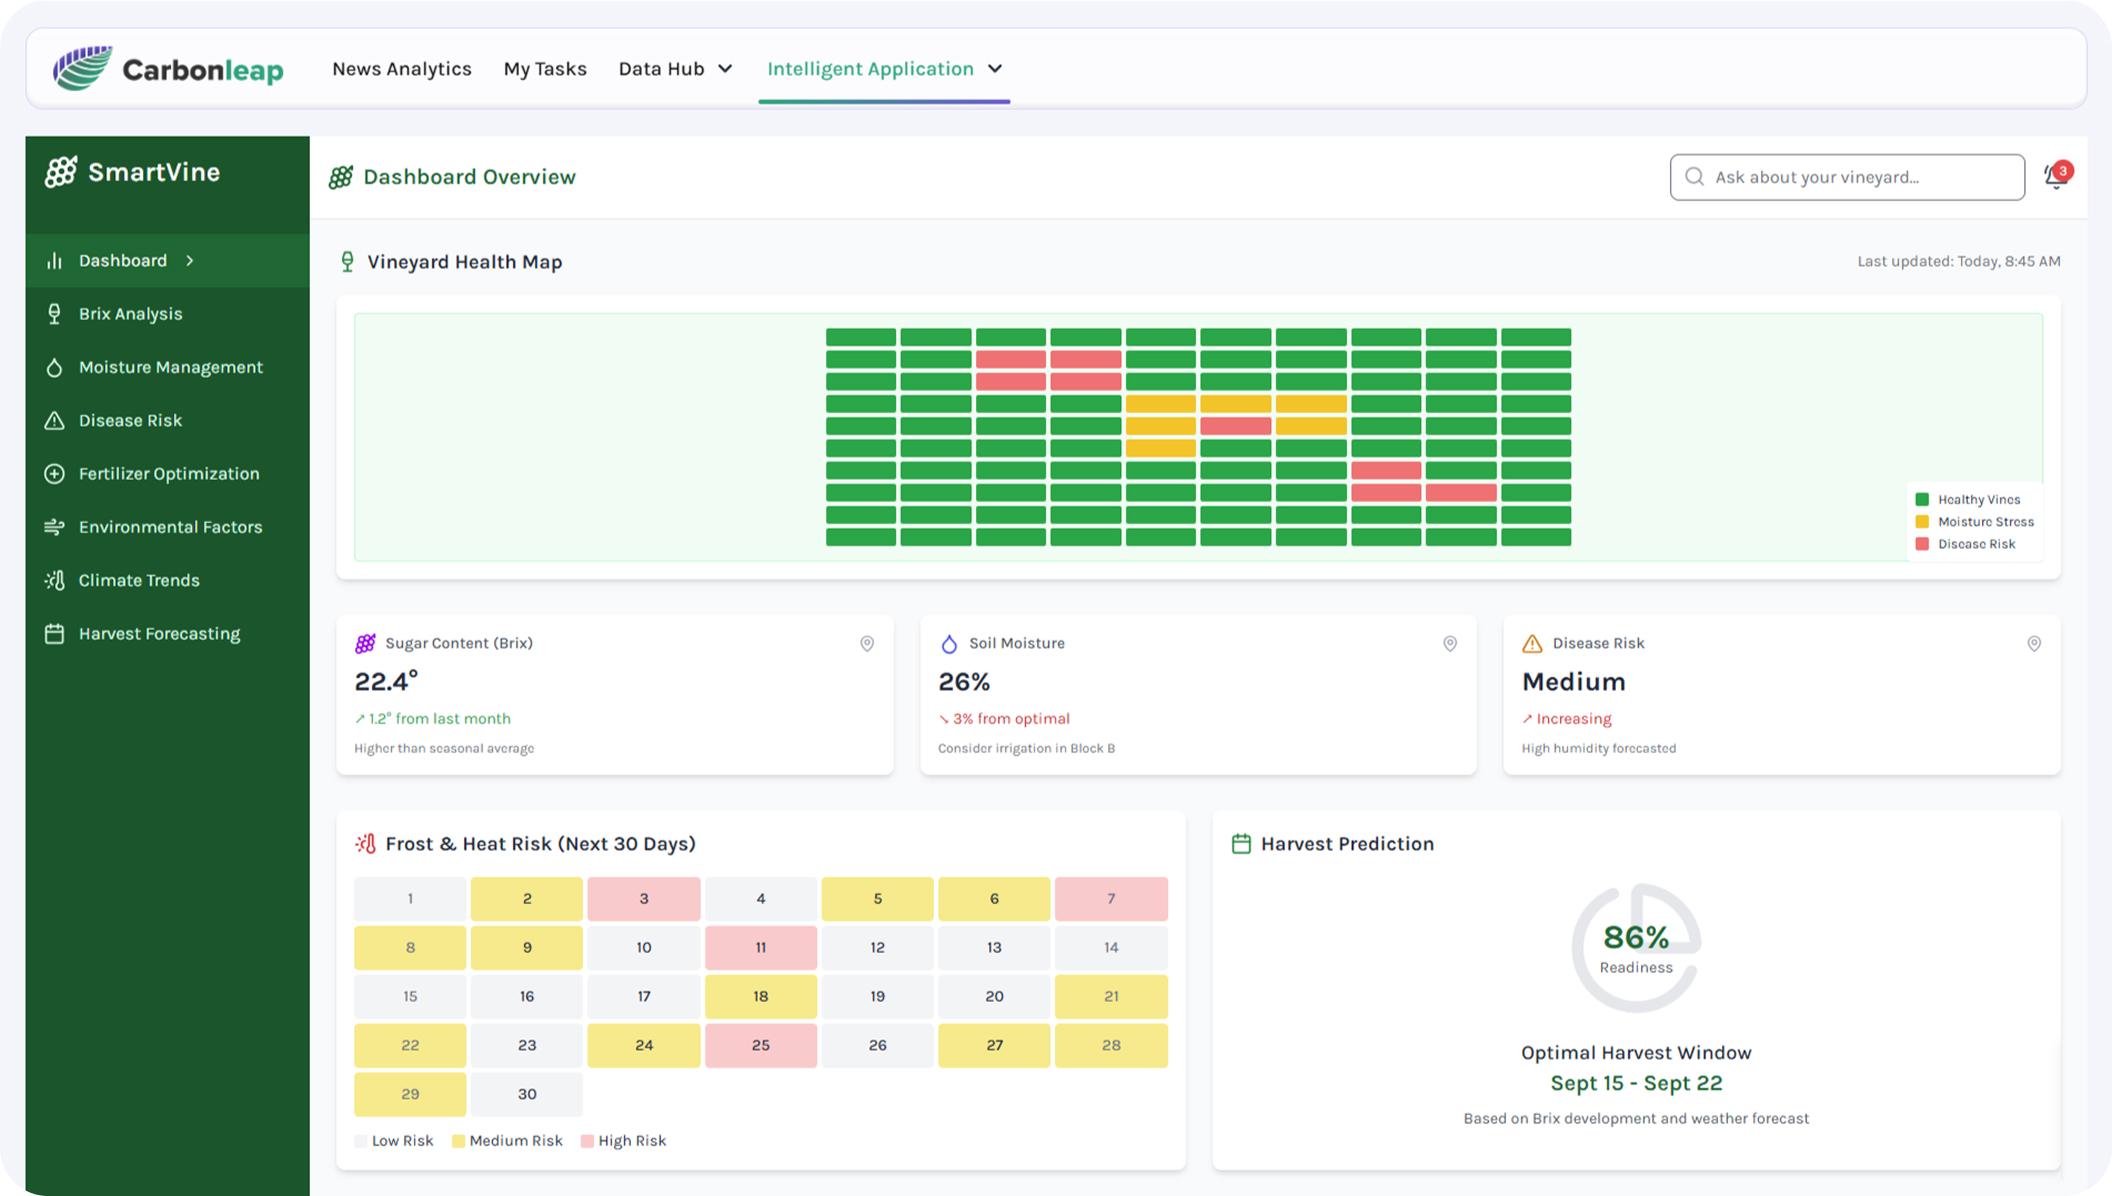
Your Farm at a Glance
Visualize real-time performance, environmental, and productivity data through interactive dashboards.
Easily visualize farm performance, environment, and productivity metrics
Clear dashboards provide real-time insights
Spot possible anomalies and areas of concern
More accurate data delivers more predictability
Talk to Your Farm
Use natural language to explore farm data and receive instant summaries, trends, and recommendations.
Use AI to query farm data in plain English for quick summaries and trends
Enable deep, complex queries of a wide range of internal and external data
Support decision-making with straightforward insights
Simple interface eliminates need for specialist training
See What's Changing
Detect crop health, land use, or vegetation changes using satellite imagery and AI models.
Detect vegetation, land use, or crop health changes with NDVI data
Detailed satellite images provide clear, block-level insights
Identify trends and anomalies that may be difficult to detect at ground level
Conduct season-by-season comparisons to track long term trends
Stay Ahead with Smart Alerts
Get automatic notifications and insights based on data trends, thresholds, and detected anomalies.
Insights, anomaly detection, and proactive alerts based on collected data and trends
Automatically-deliver accurate and actionable insights, to ensure timely intervention
Integrate disparate data streams to see non-intuitive improvements and opportunities